Grid modernization, transmission expansion, renewable interconnection, data-center load growth, and aging utility infrastructure are creating sustained demand for engineers who understand the power grid.
But what are employers actually paying for that talent?
Grid Talent Hub analyzed salary data from 511 active grid-engineering job listings spanning utilities, engineering firms, grid technology companies, renewable developers, infrastructure companies, and other employers.
After removing duplicate postings and limiting the analysis to comparable USD-denominated annual salary ranges, the final salary sample contained 179 distinct roles from 72 employers.
The results show a market where six-figure compensation is common, experience has a remarkably strong relationship with advertised pay, and senior technical roles frequently carry salary ceilings above $200,000.
Key Findings
The median advertised salary midpoint was $129,500.
84.9% of analyzed roles had a salary midpoint of at least $100,000.
30.7% had a midpoint of at least $150,000.
Median midpoint increased from $95,750 for jobs requiring 0–2 years of experience to $170,052 for jobs requiring 10+ years — a 77.6% increase.
Each additional year of required experience was associated with approximately $7,200 in additional advertised salary midpoint in a simple regression.
Senior roles had a median midpoint of $145,000, compared with $108,180 for mid-level positions and $82,500 for entry-level positions.
Remote jobs showed a higher raw median salary, but much of that difference appears to come from remote openings being disproportionately senior.
The median advertised salary range was $48,810 wide.
20.7% of roles had an advertised maximum salary of at least $200,000.
The Typical Grid Engineering Salary Range Centers Around $130,000
Across the 179 distinct active salaried openings in the final sample, the median advertised salary midpoint was:
$129,500
The middle 50% of advertised salary midpoints fell between approximately:
Metric | Salary |
|---|---|
25th percentile midpoint | $105,750 |
Median midpoint | $129,500 |
75th percentile midpoint | $155,977 |
Median advertised minimum | $100,019 |
Median advertised maximum | $157,450 |
The midpoint is calculated as the halfway point between an employer's advertised minimum and maximum salary. It should not be interpreted as the salary an employer will necessarily offer or the salary an employee ultimately accepts.
Still, the distribution makes one characteristic of this labor market clear: six-figure advertised compensation is the norm across much of grid engineering.
Of the jobs analyzed:
Advertised midpoint | Share of roles |
|---|---|
$100,000+ | 84.9% |
$125,000+ | 56.4% |
$150,000+ | 30.7% |
$175,000+ | 12.3% |
$200,000+ | 5.0% |
The salary ceiling is even more notable.
37 of the 179 roles — 20.7% — advertised a maximum base salary of at least $200,000.
That does not mean one in five grid engineers earns $200,000. An advertised maximum may apply only to highly qualified candidates, expensive locations, or the upper end of a broad job level.
But it does show that $200,000+ base-salary potential is no longer unusual enough to be considered an outlier in senior segments of the grid-engineering market.
Experience Is One of the Strongest Predictors of Advertised Pay
The clearest relationship in the dataset was between required experience and salary.
Of the 179 salaried jobs in the final sample, 166 included a usable experience requirement.
Grouping those positions by minimum required experience produced a remarkably consistent progression:
Required experience | Jobs analyzed | Median salary midpoint |
|---|---|---|
0–2 years | 34 | $95,750 |
3–5 years | 67 | $125,000 |
6–9 years | 32 | $145,529 |
10+ years | 33 | $170,052 |
The increase from the first group to the last is approximately 77.6%.
The largest jump occurs relatively early.
Moving from the 0–2 year group to the 3–5 year group corresponds with a 30.5% increase in median advertised midpoint, from $95,750 to $125,000.
The increases continue after that:
Experience transition | Increase in median midpoint |
|---|---|
0–2 → 3–5 years | +30.5% |
3–5 → 6–9 years | +16.4% |
6–9 → 10+ years | +16.9% |
A simple regression across all 166 jobs with experience data found that each additional year of required experience was associated with approximately $7,219 in additional advertised salary midpoint.
Experience alone explained about 50% of the variation in salary midpoint within this sample.
That is an unusually strong relationship for job-posting data.
It also helps explain why compensation comparisons that ignore experience can be misleading. A specialty may appear to pay more simply because the available openings in that specialty skew toward lead, principal, or senior positions.
Senior Grid Engineers Command a Large Pay Premium
Seniority labels tell a similar story.
We excluded the associate category from the primary comparison because only three deduplicated openings carried that designation.
Among the major seniority groups:
Seniority | Jobs | Median advertised midpoint |
|---|---|---|
Entry level | 11 | $82,500 |
Mid-level | 49 | $108,180 |
Senior | 116 | $145,000 |

The median midpoint for senior roles was approximately 34% higher than the mid-level median and roughly 76% higher than the entry-level median.
The entry-level sample is relatively small, so the exact $82,500 figure should be treated cautiously. The much larger mid-level and senior samples, however, reinforce the broader experience analysis.
In this dataset, compensation rises materially as grid engineers move into roles requiring deeper system knowledge, project ownership, design authority, technical leadership, or specialized expertise.
Which Grid Engineering Specialties Pay the Most?
To compare technical areas, Grid Talent Hub assigned jobs to one primary discipline using job-title terminology.
For example, roles containing protection or relay terminology were classified under Protection & Control; SCADA, ADMS, EMS, and automation roles were classified separately; and transmission, distribution, substation, and power-systems roles were categorized based primarily on title language.
Because job responsibilities often overlap, these categories should be interpreted as a way to describe the current openings — not as rigid professional boundaries.
Primary discipline | Jobs | Median advertised midpoint |
|---|---|---|
SCADA / Automation | 23 | $140,000 |
Transmission | 25 | $133,129 |
Substation | 32 | $131,071 |
Power Systems / Studies | 31 | $129,500 |
Protection & Control | 44 | $126,409 |
Distribution | 13 | $112,842 |

At first glance, SCADA and automation appear to lead the sample, followed by transmission and substation engineering.
That finding deserves an important qualification.
These are not controlled comparisons.
The mix of seniority, employers, geography, and required experience differs among specialties. A discipline with more senior openings will naturally produce a higher median.
Looking only at senior positions narrows some of those differences:
Senior discipline | Senior jobs | Median midpoint |
|---|---|---|
Substation | 19 | $150,000 |
Transmission | 21 | $149,168 |
SCADA / Automation | 12 | $148,617 |
Power Systems / Studies | 18 | $137,675 |
Protection & Control | 29 | $135,000 |
Distribution | 9 | $130,000 |
The lesson is less that one specialty definitively “wins” and more that multiple grid-engineering tracks support mid-$100,000 compensation at senior levels.
Specialization matters, but experience and job level appear to matter even more.
Remote Grid Jobs Pay More — But There Is a Catch
The raw salary data appears to show a remote-work premium.
Work arrangement | Jobs | Median midpoint |
|---|---|---|
Hybrid | 49 | $122,275 |
On-site | 75 | $127,263 |
Remote | 55 | $135,000 |

The remote median is approximately 6% above the on-site median and 10% above the hybrid median.
But the composition of those jobs is very different.
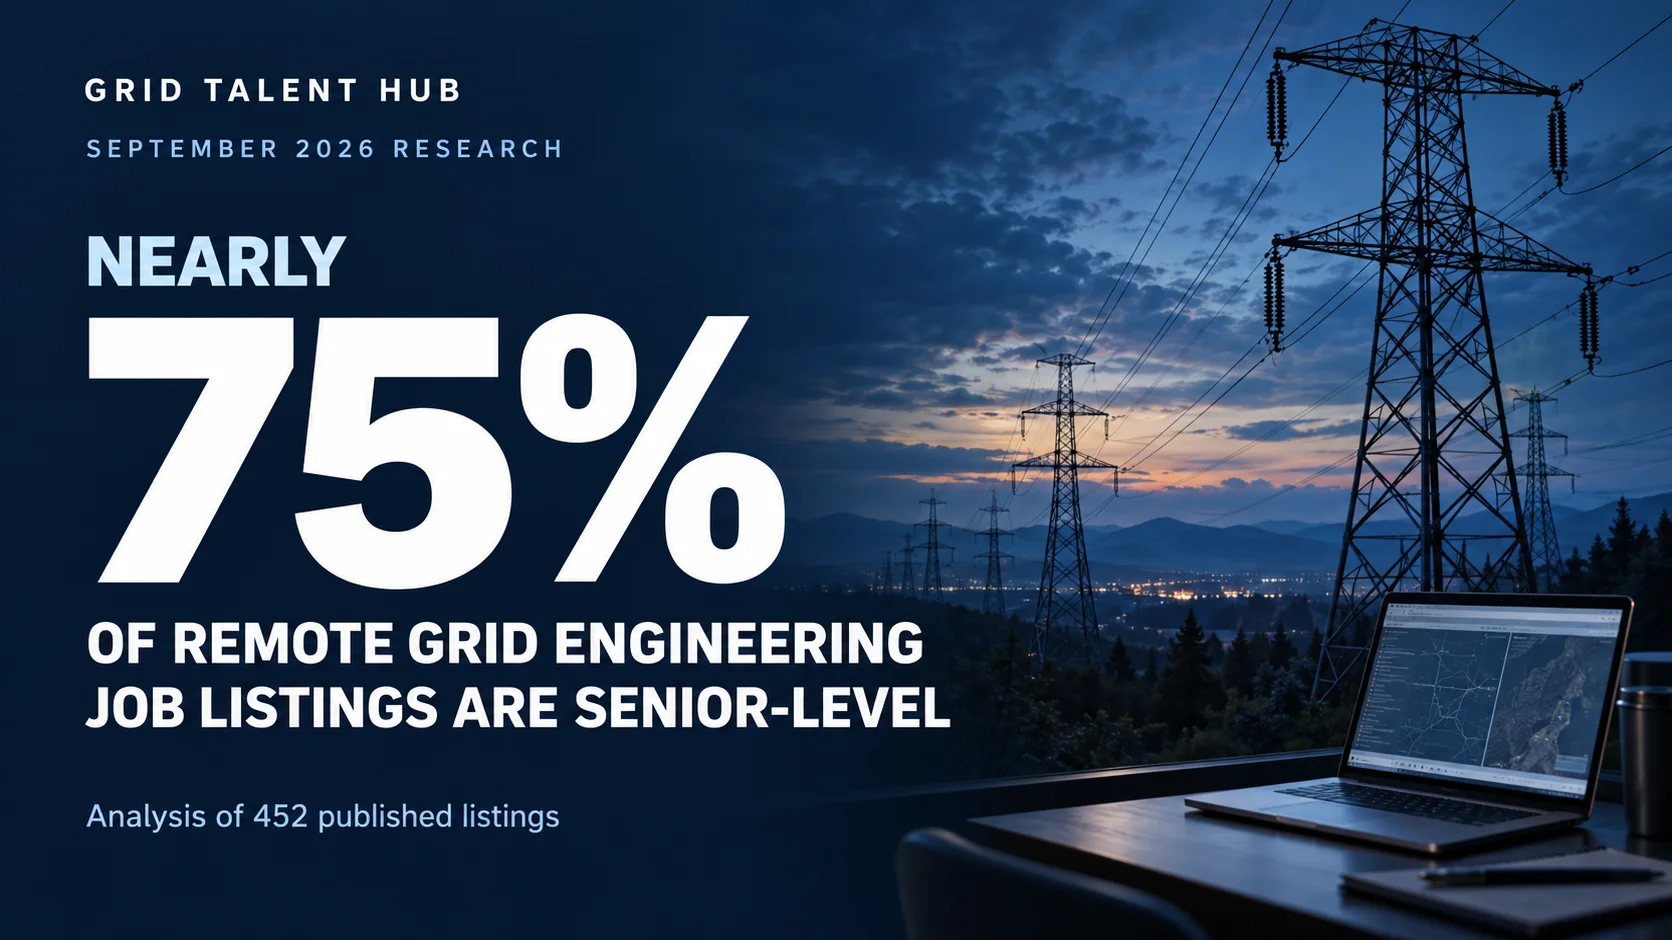
Among remote salaried openings, 76.4% were senior-level positions.
Senior roles represented:
Work arrangement | Share senior |
|---|---|
Hybrid | 63.3% |
On-site | 57.3% |
Remote | 76.4% |
When the analysis is restricted to senior jobs, the gap becomes much smaller:
Senior work arrangement | Median midpoint |
|---|---|
On-site | $142,367 |
Hybrid | $145,000 |
Remote | $147,834 |
Among senior positions, the remote median was only about 3.8% higher than the on-site median.
A regression controlling for required experience also found little evidence of a meaningful independent remote salary premium in this sample.
In other words:
Remote grid-engineering jobs appear to pay more primarily because the remote opportunities being advertised are more senior.
That distinction matters for engineers evaluating remote work. Remote positions may provide access to highly compensated jobs, but the data does not show that employers are necessarily paying substantially more simply because a job is remote.
Salary Bands in Grid Engineering Are Extremely Wide
Another striking feature of the dataset is the width of advertised salary ranges.
The median difference between the minimum and maximum advertised salary was $48,810.
Nearly half of all ranges were at least $50,000 wide.
Salary-range width | Share of postings |
|---|---|
$50,000 or wider | 48.6% |
$75,000 or wider | 19.6% |
$100,000 or wider | 5.0% |
The middle 50% of salary-band widths ran from approximately $30,000 to $70,681.
For candidates, that means the salary attached to a job title often provides considerably less precision than it first appears.
A position advertised at $110,000–$170,000 technically has a published salary range, but the final offer can still vary by tens of thousands of dollars based on experience, licensing, geographic location, technical expertise, and internal leveling.
For employers, these wide bands may also reflect the difficulty of recruiting highly specialized grid talent across multiple experience levels.
Geography Matters, but the Sample Is Not Strong Enough for a State Ranking
Location clearly influences engineering compensation, but geographic salary comparisons require caution.
Many remote positions do not have a single state associated with them, and several states had only a handful of salary-transparent openings.
Among states with at least five qualifying postings, the current sample produced the following medians:
State | Jobs | Median midpoint |
|---|---|---|
California | 26 | $154,344 |
Colorado | 8 | $137,500 |
Texas | 9 | $131,000 |
Georgia | 5 | $122,275 |
Illinois | 11 | $121,650 |
New York | 6 | $108,000 |
Washington | 5 | $105,500 |
Minnesota | 7 | $92,000 |
California's result is unsurprising given both its labor market and the number of higher-paying senior technical roles represented in the sample.
But this table should not be interpreted as a ranking of what grid engineers earn in each state.
The samples differ materially in employer composition, seniority, specialty, and salary-disclosure practices. A larger longitudinal dataset would be needed before drawing strong conclusions about state-level compensation.
How Does This Compare With Electrical Engineering Overall?
For context, the U.S. Bureau of Labor Statistics reported a $120,630 median annual wage for electrical engineers in May 2025. Electrical engineers working specifically in electric power generation, transmission, and distribution had a median annual wage of $122,430.
The $129,500 figure in the Grid Talent Hub dataset is not directly comparable with those numbers.
BLS measures wages actually earned by workers, while this analysis measures the midpoint of salary ranges attached to current job openings. The Grid Talent Hub dataset also disproportionately covers specialized power-system and grid roles rather than the entire electrical-engineering profession.
Still, the comparison provides useful context: the advertised compensation in current grid-focused openings is consistent with a technically specialized engineering labor market where six-figure pay is common.
What the Data Says About Grid Engineering Careers
The strongest conclusion from this dataset is not that one particular grid specialty guarantees the highest salary.
It is that experience and technical seniority have enormous economic value in the grid sector.
The advertised midpoint rises from roughly $96,000 for jobs requiring no more than two years of experience to roughly $170,000 for positions requiring a decade or more.
At the same time, more than one in five analyzed jobs advertised salary ceilings of at least $200,000.
That suggests a career market with a relatively high compensation floor for engineers, meaningful salary progression through the first decade of experience, and substantial upside for engineers who develop scarce expertise and progress into senior technical roles.
Transmission, substation engineering, protection and control, SCADA and automation, power-system studies, and distribution all show pathways into six-figure compensation.
The data also offers an important warning about interpreting job-board salary statistics: seniority composition matters enormously.
Remote jobs, specialties, states, and employers can appear more lucrative simply because the available openings require more experience.
For engineers comparing opportunities, job level and required experience may therefore be more useful compensation benchmarks than title alone.
Methodology
Grid Talent Hub analyzed a snapshot of its grid-engineering jobs database on September 18, 2026.
The database contained 586 total records, including expired and draft listings.
To focus the salary study on currently available opportunities, we first restricted the dataset to 511 listings marked published.
Of those, 256 contained both a usable minimum and maximum annual salary after normalization.
We then removed duplicate postings where the same employer, job title, and salary range appeared multiple times — a common occurrence when employers advertise substantially identical positions in several locations.
The primary analysis was restricted to USD-denominated annual salary ranges and excluded an explicitly Canadian USD posting.
The resulting core sample contained:
179 distinct active salaried roles from 72 employers.
For each job, the advertised salary midpoint was calculated as:
(minimum salary + maximum salary) ÷ 2
Experience analysis was based on 166 jobs with a usable experience requirement.
Discipline categories were assigned primarily from job-title language. Roles containing protection or relay terminology were classified as Protection & Control; SCADA, ADMS, EMS, and automation titles were classified as SCADA / Automation; transmission, distribution, and substation titles were classified accordingly; and power-system, studies, planning, interconnection, and related titles were grouped under Power Systems / Studies.
Salary data represents advertised base compensation ranges rather than actual employee earnings. Bonuses, overtime, equity compensation, benefits, and other forms of compensation may not be included.
The dataset is a snapshot of available jobs rather than a census of the entire grid-engineering workforce. Results may be affected by the mix of participating employers, geographic salary-transparency requirements, current hiring demand, job seniority, and which employers choose to publish compensation.
Grid Talent Hub intends to repeat this analysis as the dataset grows, allowing future reports to measure how grid-engineering compensation changes over time.
Data analysis by Grid Talent Hub. When citing this research, please attribute findings to the “Grid Talent Hub 2026 Grid Engineering Salary Report.”